
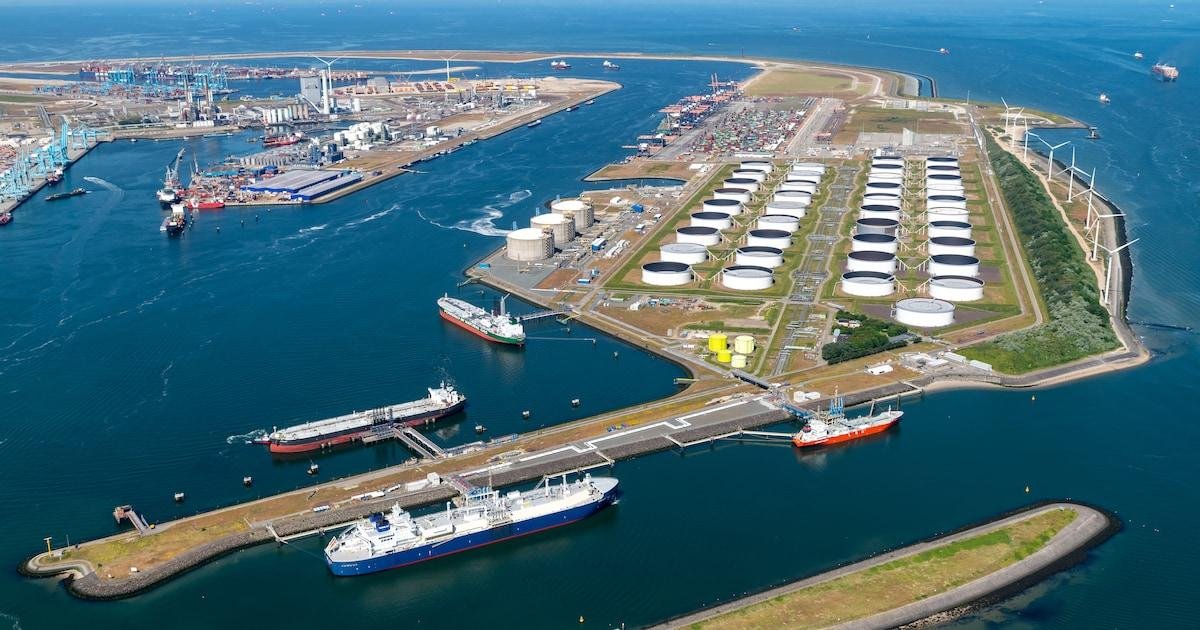
Why Tracking Natural Gas Prices Matters in the Global Energy Market
Learn how to track natural gas prices across global markets using Henry Hub, European TTF, JKM LNG and MCX futures. Explore live charts, historical prices, market trends and key price drivers.
Natural gas is one of the most important energy commodities in the modern world. It powers electricity generation, heats homes, supports industrial manufacturing and plays a significant role in international energy trade. From households in Europe using gas for heating to factories in India relying on it for production, natural gas prices influence businesses, governments and consumers across different economies.

However, natural gas does not have one universal global price.
Unlike some commodities that have a relatively straightforward international pricing reference, natural gas is traded through several regional markets. Prices can vary depending on transportation infrastructure, pipeline availability, liquefied natural gas (LNG) shipments, weather conditions, storage levels and regional demand.
For example, the United States primarily follows the Henry Hub benchmark, Europe uses the Dutch Title Transfer Facility (TTF) as a major reference, while Asian LNG buyers frequently monitor the Japan-Korea Marker (JKM). Indian commodity market participants can also track natural gas through Multi Commodity Exchange (MCX) futures.
This creates an important question: How can you track natural gas prices across global markets without confusing different benchmarks, contracts and price movements?
The answer is to monitor multiple regional benchmarks, understand how futures contracts work, compare historical price movements and follow the fundamental factors affecting supply and demand.
Whether you are an energy market researcher, commodity trader, investor, industrial buyer or someone interested in global commodity prices, understanding these indicators can help you interpret market movements more effectively.
In this guide, we will explore the major natural gas benchmarks, useful price-tracking platforms, historical charts, futures market indicators and the economic factors that influence natural gas prices worldwide.
1. Understand the Global Natural Gas Spot Price and Futures Market
Before tracking natural gas prices, it is important to understand the difference between spot prices and futures prices. These two pricing mechanisms are closely connected, but they represent different aspects of the energy market.
What Is the Natural Gas Spot Price?
The natural gas spot price represents the current market price at which natural gas can be purchased for relatively immediate delivery. It generally reflects the balance between available supply and immediate consumption requirements in a particular region.
Spot prices can change rapidly because natural gas demand is heavily influenced by weather, industrial activity, pipeline capacity and electricity generation.
For example, imagine an unusually cold winter across the United States. Households and businesses increase their heating consumption, creating additional demand for natural gas. If production and storage withdrawals cannot immediately satisfy this demand, spot prices may rise.
Similarly, if warmer weather reduces heating requirements while production remains strong, natural gas prices may experience downward pressure.
Spot prices are not necessarily identical across countries because natural gas transportation is more complicated than transporting many other internationally traded commodities.
Pipeline infrastructure connects certain markets, while LNG shipping connects otherwise separate regional markets. Liquefaction capacity, shipping availability, regasification terminals and transportation costs all influence the final delivered price.
What Is the Natural Gas Futures Price?
Natural gas futures are standardized exchange-traded contracts that allow market participants to buy or sell exposure to natural gas for a specified future delivery period.
These contracts are used by:
-
Energy producers managing future selling prices.
-
Electricity companies protecting themselves against rising fuel costs.
-
Industrial consumers managing energy procurement expenses.
-
Commodity traders seeking exposure to market movements.
-
Financial institutions managing commodity-related risks.
A futures price reflects market expectations and the pricing of future delivery, including expected supply and demand, storage conditions, weather forecasts, financing and other market factors.
For example, suppose the current natural gas spot price is $3.00 per MMBtu, while a futures contract for a future month trades at $3.40 per MMBtu.
This difference does not automatically mean traders expect the price to increase by exactly $0.40. The futures price also reflects factors such as the delivery period, market structure, storage economics and risk premiums.
Two important concepts help explain this relationship:
Contango: A futures market structure in which longer-dated contracts trade above nearby contracts.
Backwardation: A market structure in which nearby contracts trade above longer-dated contracts.
When tracking natural gas, always identify whether a platform is displaying a spot assessment, a front-month futures contract or a longer-dated futures price. Comparing these without understanding the difference can lead to incorrect conclusions.
Why Do Global Natural Gas Prices Differ?
There are several reasons why natural gas prices vary between regional markets.
|
Factor |
How it affects natural gas prices |
|---|---|
|
Transportation |
Pipeline and LNG shipping costs create regional price differences. |
|
Weather |
Cold winters and hot summers can increase consumption. |
|
Storage |
Low inventories can increase supply concerns. |
|
Production |
Higher production can create downward price pressure. |
|
LNG availability |
Competition for cargoes affects regional prices. |
|
Currency movements |
Exchange rates influence international purchasing costs. |
|
Geopolitical developments |
Supply disruptions and trade restrictions can affect prices. |
The most important lesson is that there is no single price chart that explains the entire global natural gas market.
To understand international price movements, you need to monitor multiple benchmarks.
2. Track the Three Major Natural Gas Benchmarks: Henry Hub, TTF and JKM
The easiest way to understand international natural gas pricing is to follow three important regional benchmarks.
These are Henry Hub in North America, TTF in Europe and JKM in Northeast Asia.
Each benchmark represents a different geographical market and pricing mechanism.
A. Henry Hub Natural Gas Benchmark Price (NYMEX)
Henry Hub is a physical natural gas distribution hub located in Louisiana, United States. It connects multiple interstate and intrastate pipelines, making it an important location for natural gas trading and delivery.
The NYMEX Henry Hub Natural Gas futures contract, traded through CME Group, is widely used by producers, utilities, traders and other energy market participants.
Its price is quoted in US dollars per million British thermal units ($/MMBtu).
According to CME Group, the standard Henry Hub futures contract represents 10,000 MMBtu of natural gas. The contract has a minimum price fluctuation of $0.001 per MMBtu.
Where to Track Henry Hub Natural Gas Prices
You can monitor Henry Hub prices using the following platforms:
-
CME Group – Official futures prices, contract information and market data.
-
Trading Economics – Historical price charts, market trends and economic commentary.
-
Investing.com – Live market information, charts and technical indicators.
-
Business Insider Markets – Natural gas price information and market coverage.
What Should You Monitor?
When following Henry Hub, pay attention to:
-
Current natural gas futures price.
-
Front-month futures contract.
-
Weekly US natural gas storage changes.
-
Natural gas production levels.
-
LNG export demand.
-
Weather forecasts across major US consumption regions.
-
Futures trading volume and open interest.
For example, an unexpected cold-weather forecast across the northeastern United States may increase expectations of heating demand. If production and storage are insufficient to offset that demand, Henry Hub futures may experience upward pressure.
However, weather forecasts alone do not determine the direction of prices. Production, pipeline constraints and storage availability must also be considered.
B. European TTF (Title Transfer Facility) Natural Gas Prices
The European TTF (Title Transfer Facility) is a major natural gas benchmark used throughout the European energy market.
TTF is a virtual trading point in the Netherlands. It serves as a central reference for trading natural gas in the European market.
Unlike Henry Hub, which represents a physical delivery hub, TTF operates as a virtual trading point within the Dutch gas transmission system.
European natural gas prices are particularly sensitive to:
-
LNG imports and availability.
-
Pipeline supply from producing regions.
-
European underground storage levels.
-
Industrial gas consumption.
-
Winter heating demand.
-
Renewable electricity generation.
-
Geopolitical developments affecting energy supply.
TTF futures are traded on ICE. Prices are generally quoted in euros per megawatt-hour (€/MWh).
ICE identifies TTF as a major international natural gas benchmark, with its pricing influencing LNG contracts and gas trading across several regions.
Where to Track European TTF Prices
You can use these resources:
-
ICE TTF Natural Gas – Official benchmark and futures market information.
-
S&P Global Energy – European and international natural gas market assessments.
-
Trading Economics – Historical commodity data and market research.
Important Factors to Monitor in Europe
European natural gas prices can behave differently from US prices.
For example, the United States might experience strong natural gas production while Europe faces reduced pipeline availability or higher LNG import competition.
In such circumstances, Henry Hub prices could remain relatively stable while European TTF prices increase.
This is why international energy analysts compare regional benchmarks instead of relying on one market.
When studying TTF, monitor the following indicators:
-
European gas storage percentage.
-
LNG cargo arrivals.
-
Pipeline import volumes.
-
Industrial gas consumption.
-
Weather forecasts.
-
Electricity demand.
-
TTF front-month and winter futures prices.
One useful approach is to compare summer and winter futures contracts. This helps identify how the market is pricing seasonal supply requirements.
C. Japan-Korea Marker (JKM) Liquefied Natural Gas Benchmark
The Japan-Korea Marker (JKM) is an important benchmark for spot LNG cargo prices in Northeast Asia.
Unlike Henry Hub and TTF, which are closely associated with regional natural gas trading hubs, JKM specifically reflects the market value of LNG cargoes delivered to Japan, South Korea, China and Taiwan.
It is published by S&P Global Energy under the Platts JKM assessment.
JKM is widely referenced in LNG spot transactions, tenders and short-, medium- and long-term commercial agreements.
The benchmark reflects the value of LNG delivered on an ex-ship (DES) basis into the relevant Northeast Asian markets.
S&P Global uses market information such as confirmed trades, bids, offers and indications of tradable value in its assessment process.
Where to Track JKM LNG Prices
Useful resources include:
-
S&P Global Platts JKM – Benchmark explanation and pricing methodology.
-
ICE Global Natural Gas Futures – JKM derivatives and international gas market information.
-
S&P Global LNG Market Data – Regional LNG assessments and shipping information.
Why Does JKM Matter?
Asia is a major destination for internationally traded LNG.
Countries such as Japan, South Korea and China depend on LNG imports to meet different proportions of their domestic energy requirements.
When Asian demand increases, buyers may compete for available LNG cargoes. This can influence JKM prices and shipping decisions.
For example, if Japan experiences unusually cold weather while LNG supply remains limited, importers may compete for additional spot cargoes.
This increased competition can push JKM prices higher.
However, the relationship between JKM and TTF is also important. LNG suppliers may compare the potential revenue from delivering cargoes to Europe or Asia after accounting for transportation and other costs.
Consequently, regional price differences can influence international LNG trade flows.

Comparing Henry Hub, TTF and JKM
|
Benchmark |
Region |
Common price unit |
Main market |
|---|---|---|---|
|
Henry Hub |
United States |
USD/MMBtu |
Pipeline natural gas |
|
TTF |
Europe |
EUR/MWh |
European natural gas |
|
JKM |
Northeast Asia |
USD/MMBtu |
Spot LNG cargoes |
Remember that these benchmarks are not interchangeable. They represent different delivery locations, products and market structures.
When comparing them, consider currency conversion, energy-unit conversion, delivery terms and transportation costs.
3. How to Track MCX Natural Gas Futures, Historical Prices and Live Charts
If you are based in India or follow the Indian commodity derivatives market, MCX natural gas futures are particularly useful.
The Multi Commodity Exchange of India (MCX) provides a platform for trading natural gas futures contracts. These contracts connect India’s commodity derivatives market with international natural gas pricing, particularly the Henry Hub benchmark.
A. MCX Natural Gas Futures Price and Contract Specifications
MCX natural gas futures allow market participants to take positions based on expected movements in natural gas prices.
The contracts are quoted in Indian rupees per MMBtu.
The standard MCX Natural Gas contract has a trading unit of 1,250 MMBtu, while the Natural Gas Mini contract has a smaller trading unit of 250 MMBtu.
MCX publishes official contract specifications, including applicable contract sizes and contract documents.
Important MCX Natural Gas indicators
|
Indicator |
What it tells you |
|---|---|
|
Last traded price (LTP) |
Most recent traded contract price |
|
Open price |
Price at which the contract opened |
|
Day high |
Highest traded price during the session |
|
Day low |
Lowest traded price during the session |
|
Previous close |
Previous trading session’s closing price |
|
Trading volume |
Number of contracts traded |
|
Open interest |
Outstanding futures positions |
|
Expiry date |
Last trading date according to the contract calendar |
These indicators help you understand the current market situation.
For example, suppose MCX natural gas futures increase from ₹250 to ₹265 per MMBtu.
A trader should not automatically assume that the market has entered a strong bullish trend.
It is important to investigate whether the increase is supported by higher trading volume, changing open interest, international benchmark movements or a significant supply disruption.
Where to Track MCX Natural Gas Prices
You can use the following websites:
-
MCX Official Website – Official contract specifications and exchange information.
-
Groww – MCX natural gas futures price information.
-
Investing.com – International natural gas futures charts and technical indicators.
-
CME Group – International benchmark and futures information.
Always verify the latest trading hours, contract specifications, expiry dates and settlement conditions with the exchange because these details can change.
B. How International Natural Gas Prices Affect MCX
One important aspect of MCX natural gas trading is its connection with international markets.
International Henry Hub movements, USD-INR exchange rates and contract-specific pricing arrangements can influence the Indian market.
Consider a simplified example.
Suppose international natural gas prices increase by 5%, while the Indian rupee weakens against the US dollar.
Both developments can create upward pressure on the imported-equivalent value of natural gas.
However, the actual MCX price movement may differ because of contract settlement methodology, market expectations, domestic trading conditions and the relevant international contract month.
This is why traders should compare MCX futures with international benchmarks rather than analyzing Indian prices in isolation.
C. How to Read Natural Gas Historical Price Data and Live Price Charts
Live prices help you understand what is happening in the market now. Historical price data helps you understand why the market is moving and how frequently similar movements have occurred.
For a complete analysis, you should study both.
1. Daily price charts
Daily charts help identify short-term price movements.
You can use them to observe:
-
Daily opening and closing prices.
-
Intraday highs and lows.
-
Short-term support and resistance.
-
Sudden market movements.
-
Trading volume changes.
2. Weekly price charts
Weekly charts provide a broader perspective.
They are useful for identifying seasonal trends, longer price movements and changes in market sentiment.
For example, you may notice that natural gas prices frequently experience increased volatility during winter heating seasons.
3. Monthly and yearly price charts
Monthly and yearly charts help identify long-term market cycles.
They are particularly useful for researchers and investors who want to understand:
-
Historical price peaks.
-
Major supply disruptions.
-
Long-term demand growth.
-
Seasonal price patterns.
-
Changes in global production capacity.
4. Historical price comparisons
Do not study historical prices without considering the circumstances behind them.
A price increase caused by an unusually cold winter may have a different explanation from an increase caused by a pipeline disruption or reduced LNG exports.
The market context is just as important as the price itself.
Best Platforms for Natural Gas Historical Data
|
Platform |
Useful information |
|---|---|
|
Trading Economics |
Historical commodity prices and charts |
|
Investing.com |
Historical prices, technical charts and market indicators |
|
Business Insider Markets |
Natural gas commodity price coverage |
|
CME Group |
Official futures contracts and market information |
|
Groww |
Indian MCX futures market information |
|
S&P Global Energy |
Regional gas and LNG price assessments |
One important distinction: a platform may display delayed exchange prices, indicative market prices or third-party data rather than an official real-time exchange feed.
For serious research, check the data provider, timestamp, benchmark and contract month.
D. Understanding Natural Gas Futures Expiry Dates, Trading Volume and Open Interest
Three additional indicators can improve your understanding of natural gas futures markets.
Futures expiry dates
Every futures contract has a defined expiration date.
As a contract approaches expiry, traders may close existing positions or transfer exposure into a later contract. This process is called rolling over a futures position.
For example, someone holding a November natural gas futures contract may close that position and enter a December contract before the November contract expires.
The two contracts may have different prices because of changes in seasonal demand and the futures market structure.
Never assume that the front-month contract displayed on a chart will remain the same throughout the year.
Trading volume
Trading volume represents the number of contracts traded during a particular period.
Higher volume can indicate increased market participation.
For example, if natural gas prices increase alongside rising trading volume, it may suggest stronger trading activity behind the price movement.
However, volume alone does not confirm whether a trend will continue.
Open interest
Open interest represents the number of outstanding futures contracts that have not yet been closed, exercised or otherwise settled.
It provides information about the amount of outstanding market exposure.
A simple interpretation framework is:
|
Price movement |
Open interest |
Possible interpretation |
|---|---|---|
|
Price rises |
OI rises |
New positions may be supporting the move |
|
Price falls |
OI rises |
New positions may be supporting downward pressure |
|
Price rises |
OI falls |
Short covering may be contributing |
|
Price falls |
OI falls |
Long liquidation may be contributing |
These are commonly used analytical interpretations, not guaranteed trading signals.
For example, rising natural gas prices accompanied by increasing open interest and strong volume may indicate growing participation in the upward movement.
However, you should also examine market fundamentals, expiry-related activity and the positions of different market participants.
4. Understand Global LNG Supply, Demand and Natural Gas Price Drivers
Tracking natural gas prices is not simply about watching charts.
The most important price movements often begin with changes in physical supply and demand.
Natural gas is a globally connected but regionally constrained commodity. Pipeline networks, LNG terminals, shipping capacity and storage infrastructure determine how easily gas can move between markets.
Understanding these relationships can help explain why Henry Hub, TTF, JKM and MCX prices sometimes move together and sometimes move in different directions.
A. Global LNG Supply and Demand
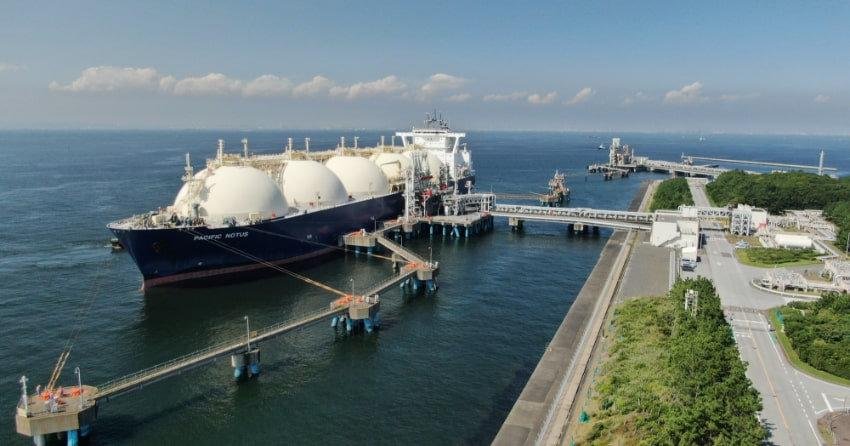
Liquefied natural gas (LNG) plays a major role in connecting natural gas markets across continents.
Natural gas is cooled to approximately -162°C to convert it into liquid form. This significantly reduces its volume, making it easier to transport using specially designed LNG carriers.
At the destination, LNG is regasified and transferred into pipelines for consumption.
The international LNG supply chain includes several stages:
-
Natural gas exploration and production.
-
Gas processing and purification.
-
Liquefaction at export terminals.
-
Transportation through LNG carriers.
-
Regasification at import terminals.
-
Distribution through pipeline networks.
-
Consumption by industrial, commercial and residential customers.
Each stage can influence the final delivered cost of natural gas.
For example, if an LNG export facility experiences an unexpected shutdown, fewer cargoes may become available to international buyers.
If alternative suppliers cannot immediately replace the missing volumes, regional LNG prices may increase.
Similarly, higher LNG production capacity can improve global supply availability and potentially reduce competition for spot cargoes.
Important LNG supply and demand indicators
|
Indicator |
Why it matters |
|---|---|
|
LNG export volumes |
Measures international supply availability |
|
LNG import volumes |
Indicates regional purchasing demand |
|
Liquefaction capacity |
Determines export potential |
|
Regasification capacity |
Determines import handling capability |
|
LNG vessel movements |
Provides information about cargo transportation |
|
Shipping rates |
Influence delivered LNG costs |
|
LNG terminal outages |
Can disrupt regional supply |
For a global commodity price-tracking website, these indicators provide useful context alongside benchmark price charts.
B. Natural Gas Storage Inventories
Natural gas storage is one of the most important indicators for understanding market balance.
Countries and energy companies store natural gas during periods of relatively lower demand or greater supply availability.
The stored gas can then be withdrawn when consumption increases, particularly during winter heating seasons.
In the United States, the Energy Information Administration (EIA) publishes weekly natural gas storage reports.
These reports provide information about working gas inventories and weekly changes in storage levels.
You can access the official information through the EIA Natural Gas Storage Data.
How Storage Changes Affect Prices
Consider two different situations.
Situation 1: Lower-than-expected storage levels
Suppose analysts expect US natural gas inventories to increase by 70 billion cubic feet during a reporting week, but actual inventories increase by only 40 billion cubic feet.
The smaller-than-expected injection may indicate tighter supply-demand conditions than the market anticipated.
Depending on other market conditions, this can create upward pressure on natural gas futures.
Situation 2: Higher-than-expected storage levels
Now suppose inventories increase by 90 billion cubic feet when analysts expected an increase of only 50 billion cubic feet.
The larger injection may indicate stronger supply availability or weaker consumption than expected.
This can create downward pressure on prices.
However, storage data should always be evaluated against seasonal expectations and market forecasts.
An inventory increase is not automatically bearish, and a withdrawal is not automatically bullish.
C. Natural Gas Production and Weather-Driven Demand
Production and weather are two of the strongest fundamental factors affecting natural gas prices.
Natural gas production
Natural gas production refers to the volume of gas extracted and processed from underground reserves.
Major producing regions influence international market availability.
In the United States, production from regions such as the Permian, Haynesville and Appalachian basins contributes to the overall domestic supply picture.
Higher production can improve market availability, while unexpected declines may create supply concerns.
However, production growth does not always result in lower prices. Export demand, pipeline constraints, storage levels and consumption must also be considered.
Also Read: What Factors Affect International Crude Oil Prices
Weather-driven demand
Natural gas consumption changes significantly with seasonal weather conditions.
During winter, households and commercial buildings use more gas for heating.
During summer, natural gas consumption may increase because gas-fired power plants help meet electricity demand associated with air conditioning.
This means both unusually cold winters and extremely hot summers can influence natural gas prices.
Consider an example:
A cold-weather forecast predicts lower temperatures across several major US cities.
Energy analysts expect households to consume more natural gas for heating. Traders may adjust their positions in anticipation of higher demand.
If the weather forecast becomes more severe and storage inventories are relatively low, prices may experience additional upward pressure.
On the other hand, if temperatures turn out to be warmer than expected, heating demand may decline and the market may reverse its earlier movement.
This is why weather forecasts are closely monitored by natural gas traders.
Weather indicators worth monitoring
-
Heating Degree Days (HDD).
-
Cooling Degree Days (CDD).
-
Average regional temperatures.
-
Expected winter snowfall and cold fronts.
-
Summer heatwaves.
-
Long-range seasonal weather forecasts.
HDD and CDD are particularly useful because they translate temperature conditions into indicators of potential heating and cooling demand.
D. Geopolitical Events and International Energy Trade
Natural gas markets are also sensitive to geopolitical developments.
Conflicts, sanctions, trade restrictions, pipeline interruptions and changes in international energy agreements can influence supply availability.
For example, if a major gas-producing region experiences a pipeline disruption, importing countries may need to source replacement supplies from alternative markets.
This can increase competition for LNG cargoes.
Similarly, changes in export policies or new LNG infrastructure can influence long-term supply expectations.
When following international natural gas prices, monitor geopolitical developments alongside production, storage and demand data.
A headline alone is not enough. You should investigate whether the event actually changes physical supply availability, transportation costs or expected consumption.
5. Natural Gas Price Forecasts, Market Volatility and a Practical Tracking Strategy
Once you understand regional benchmarks and the fundamentals influencing prices, the next step is to develop a structured natural gas price-tracking system.
The objective is not simply to predict whether prices will increase or decrease. It is to understand the information behind market movements and identify changes in supply-demand conditions.
A. How to Analyse Natural Gas Price Forecasts
Natural gas price forecasts generally combine three major forms of analysis.
1. Fundamental analysis
Fundamental analysis examines the physical market conditions that influence natural gas prices.
Important variables include:
-
Natural gas production.
-
Weekly storage inventories.
-
LNG export and import volumes.
-
Pipeline supply.
-
Industrial consumption.
-
Seasonal weather forecasts.
-
Electricity generation demand.
For example, if production is declining while winter heating demand is increasing, the market may become tighter.
However, the impact on prices depends on the existing inventory position, expected demand and market expectations.
2. Technical analysis
Technical analysis studies historical price movements and trading activity to identify market trends.
Common indicators include:
|
Indicator |
Purpose |
|---|---|
|
Moving Average (MA) |
Identifies general price trends |
|
Relative Strength Index (RSI) |
Measures momentum |
|
MACD |
Helps identify momentum changes |
|
Bollinger Bands |
Measures price volatility |
|
Support and Resistance |
Identifies important price levels |
|
Volume |
Measures trading activity |
For example, a natural gas futures contract trading above its 50-day moving average may indicate positive short-term momentum.
However, technical indicators should not be used independently. Natural gas prices can change sharply following unexpected weather forecasts, storage reports or supply disruptions.
3. Market sentiment analysis
Market sentiment reflects how traders and other participants view future natural gas prices.
You can monitor:
-
Commodity market news.
-
Futures positioning reports.
-
Analyst expectations.
-
Changes in open interest.
-
Options market activity.
-
Price differences between regional benchmarks.
Combining fundamental, technical and sentiment analysis provides a more complete understanding of the market.
B. Understanding Natural Gas Market Volatility
Natural gas is known for significant price volatility.
Unlike some commodities with relatively stable consumption patterns, natural gas demand can change rapidly with weather conditions.
Its supply infrastructure can also create temporary shortages that are difficult to resolve immediately.
Several factors contribute to natural gas market volatility:
Seasonal demand: Winter heating requirements and summer electricity consumption can produce substantial price changes.
Weather forecast revisions: Even changes in expected temperatures can influence futures market expectations.
Storage surprises: Unexpected inventory injections or withdrawals can change market sentiment.
Supply disruptions: Pipeline outages, production interruptions and LNG terminal shutdowns can affect availability.
International competition: Buyers in Europe and Asia may compete for the same LNG cargoes.
Currency fluctuations: Changes in the US dollar and other currencies can affect the cost of internationally traded energy.
For traders, this volatility creates opportunities but also significant risks.
For industrial buyers, sudden price increases can affect operating expenses and procurement budgets.
For researchers, volatility makes it important to examine historical data and understand the events behind major price movements.
C. How to Track Natural Gas Prices Across Global Markets: Step-by-Step Process
If you want to monitor international natural gas prices regularly, follow this practical workflow.
Your global natural gas tracking workflow
-
Step 1: Check the international benchmarks
Monitor Henry Hub, European TTF and JKM to understand regional pricing trends.
-
Step 2: Check Indian MCX prices
Compare MCX natural gas futures with Henry Hub movements and USD-INR changes.
-
Step 3: Review historical charts
Compare daily, weekly, monthly and yearly price movements.
-
Step 4: Monitor storage reports
Review weekly EIA storage changes and compare actual figures with expectations.
-
Step 5: Follow LNG market developments
Check export volumes, import demand, shipping activity and terminal disruptions.
-
Step 6: Monitor futures market activity
Review contract expiry dates, trading volume, open interest and forward curves.
-
Step 7: Analyse weather forecasts
Monitor heating and cooling demand across major consumption regions.
-
Step 8: Record the market outlook
Document the price movement, fundamental developments and potential risks.
D. Best Websites to Track Natural Gas Prices Worldwide
You do not need to visit dozens of websites every day. A small collection of reliable sources can provide most of the information required for market research.
Here are six useful resources.
Useful for historical natural gas prices, long-term charts, market trends and economic commentary.
Useful for live or delayed futures information, technical charts, market indicators and historical data.
Useful for commodity price coverage and financial market information
Useful for professional energy market research, regional pricing assessments and LNG benchmark information.
5. Groww
Useful for tracking Indian MCX natural gas futures information.
6. CME Group
Useful for official Henry Hub futures specifications, trading information and market data.
My recommendation: Use Trading Economics and Investing.com for general price monitoring, CME for Henry Hub contract information, S&P Global for professional LNG benchmarks, and MCX/Groww for Indian futures tracking.
For authoritative physical market fundamentals, also use the US Energy Information Administration.
E. Build Your Own Natural Gas Price Tracking Dashboard
If you regularly research energy commodities, creating a simple tracking dashboard can save time.
You can build one using Excel, Google Sheets or a WordPress-based commodity price website.
A useful dashboard should contain the following sections:
|
Dashboard component |
Information to display |
|---|---|
|
Henry Hub |
Latest available benchmark price |
|
European TTF |
European natural gas price |
|
JKM LNG |
Northeast Asian LNG benchmark |
|
MCX Natural Gas |
Indian futures price |
|
Daily change |
Percentage increase or decrease |
|
Historical prices |
Daily, weekly and monthly records |
|
Storage inventories |
Latest reported working gas stock |
|
Production |
Natural gas production trends |
|
Futures volume |
Market trading activity |
|
Open interest |
Outstanding futures positions |
|
Expiry calendar |
Upcoming futures contract expirations |
|
Market news |
Important supply-demand developments |
You can also include a regional price comparison chart.
For instance, a chart comparing Henry Hub, TTF and JKM can help identify whether price movements are happening across the entire global gas market or only within one region.
However, always normalize currencies and units before making numerical comparisons.
A useful unit conversion is:
Therefore:
This formula converts a TTF price quoted in EUR/MWh into an approximate USD/MMBtu equivalent.
For example, assume:
-
TTF price = €30/MWh.
-
EUR/USD exchange rate = 1.10.
Then:
This is a currency-and-energy-unit conversion, not a delivered-price comparison. It excludes differences in benchmark location, delivery terms, transportation and other commercial costs.
A dashboard built around these indicators can help you understand global natural gas pricing much more effectively.
Conclusion: Track Multiple Benchmarks to Understand Global Natural Gas Prices
Tracking natural gas prices across global markets requires more than checking a single commodity chart.
The international natural gas market is influenced by regional benchmarks, LNG transportation, production levels, storage inventories, weather conditions and geopolitical developments.
For a complete market overview, monitor three major benchmarks: Henry Hub in the United States, TTF in Europe and JKM in Northeast Asia. If you follow Indian commodity markets, include MCX natural gas futures in your analysis.
Use historical price charts to identify long-term movements, futures volume and open interest to understand market participation, and storage reports to evaluate changes in supply-demand conditions.
Most importantly, do not interpret every price movement in isolation. A meaningful analysis connects market prices with the physical factors influencing energy supply and consumption.
Whether you are a commodity trader, energy researcher, industrial buyer or investor, developing a consistent tracking routine can help you make better-informed decisions.
Start tracking natural gas prices today by comparing Henry Hub, TTF, JKM and MCX benchmarks, and build a clearer picture of the global energy market.
FAQ: How to Track Natural Gas Prices Across Global Markets
1. How can I track natural gas prices across global markets?
You can track natural gas prices using Trading Economics, Investing.com, CME Group, S&P Global Energy and other commodity market platforms. Monitor Henry Hub, European TTF and JKM to understand regional price movements.
2. What are the major global natural gas price benchmarks?
The three important benchmarks are Henry Hub in the United States, Title Transfer Facility (TTF) in Europe and Japan-Korea Marker (JKM) for Northeast Asian LNG markets.
3. What is the Henry Hub natural gas price?
Henry Hub is a major US natural gas pricing benchmark located in Louisiana. Its price is widely referenced through NYMEX natural gas futures contracts traded on CME Group.
4. What is the TTF natural gas price?
TTF stands for Title Transfer Facility. It is a virtual natural gas trading point in the Netherlands and a leading benchmark for European natural gas prices.
5. What is the JKM LNG benchmark?
Japan-Korea Marker (JKM) is an LNG price assessment published by S&P Global Energy. It reflects the value of spot LNG cargoes delivered to Japan, South Korea, China and Taiwan.
6. Where can I check natural gas prices in real time?
You can check available natural gas market prices through Investing.com, CME Group, ICE and commodity data platforms. Check whether the displayed prices are real-time, delayed or indicative.
7. How can I check MCX natural gas prices in India?
You can monitor MCX natural gas futures through the MCX official website, Groww and other commodity market platforms.
8. What is the difference between natural gas spot prices and futures prices?
Spot prices represent current market prices for relatively immediate delivery, while futures prices represent exchange-traded contracts for specified future delivery periods.
9. What is the unit used to measure natural gas prices?
Natural gas prices are commonly quoted in US dollars per million British thermal units (USD/MMBtu). European TTF prices are generally quoted in euros per megawatt-hour (EUR/MWh).
10. How do I convert EUR/MWh into USD/MMBtu?
Multiply the EUR/MWh price by the EUR-to-USD exchange rate and divide the result by approximately 3.412.
11. Why do natural gas prices differ between countries?
Prices differ because of transportation costs, pipeline availability, LNG imports, regional supply-demand conditions, storage levels, currency movements and local market structures.
12. What factors influence global natural gas prices?
Major factors include production, storage inventories, weather, industrial consumption, LNG exports, pipeline disruptions, geopolitical developments and electricity demand.
13. How does weather affect natural gas prices?
Cold weather increases heating demand, while hot weather can increase natural gas consumption for electricity generation. Unexpected weather changes can therefore influence futures prices.
14. How do natural gas storage inventories affect prices?
Lower-than-expected storage inventories can create concerns about supply availability, while higher-than-expected inventories may indicate more comfortable supply conditions.
15. Where can I find US natural gas storage data?
The US Energy Information Administration publishes weekly natural gas storage information. Its official website provides historical inventory data and weekly reports.
16. What is the relationship between Henry Hub and MCX natural gas?
MCX natural gas futures are linked to international natural gas pricing. Henry Hub movements, currency exchange rates and contract-specific settlement arrangements can influence MCX prices.
17. What is an MCX natural gas futures contract?
It is a standardized commodity derivatives contract traded on the Multi Commodity Exchange of India. It allows market participants to take exposure to natural gas price movements.
18. What is the difference between MCX Natural Gas and Natural Gas Mini?
The standard MCX Natural Gas contract has a trading unit of 1,250 MMBtu, while Natural Gas Mini has a smaller trading unit of 250 MMBtu.
19. What is natural gas futures expiry?
Futures expiry is the specified date when a contract stops trading according to its exchange rules and moves toward its applicable settlement process.
20. What is open interest in natural gas futures?
Open interest represents the number of outstanding futures contracts that remain open. It helps analysts understand the amount of outstanding market exposure.
21. What does trading volume indicate in natural gas markets?
Trading volume indicates how many futures contracts have been traded during a particular period. It helps assess market activity and participation.
22. How can I find historical natural gas prices?
You can use Trading Economics, Investing.com, CME Group and other historical commodity data providers to study daily, weekly, monthly and yearly price movements.
23. Why are natural gas prices volatile?
Natural gas prices can be volatile because of seasonal demand, changing weather forecasts, production disruptions, storage surprises, LNG competition and geopolitical events.
24. How does LNG supply influence natural gas prices?
Higher LNG availability can improve international supply conditions, while reduced exports or increased competition for cargoes can create upward pressure on regional prices.
25. What is the difference between natural gas and LNG?
Natural gas is a gaseous fossil fuel. LNG is natural gas cooled to approximately -162°C, converting it into liquid form for easier transportation and storage.
26. Can Henry Hub and TTF prices move in opposite directions?
Yes. Regional production, transportation limitations, storage availability and LNG trade flows can cause Henry Hub and TTF prices to move differently.
27. How can I forecast natural gas prices?
You can combine fundamental analysis, historical price movements, technical indicators, weather forecasts, production data, storage inventories and LNG market information.
28. Which websites provide global LNG price information?
S&P Global Energy and ICE provide useful LNG benchmark and derivatives information, including JKM and European natural gas market data.
29. What is the best way to compare natural gas prices internationally?
Compare Henry Hub, TTF and JKM using consistent energy units and currencies. Also consider transportation costs, delivery locations and benchmark differences.
30. Is natural gas price tracking useful for investors and businesses?
Yes. It helps commodity traders understand market movements, industrial buyers monitor energy procurement costs, researchers analyse energy trends and businesses evaluate market risks.
